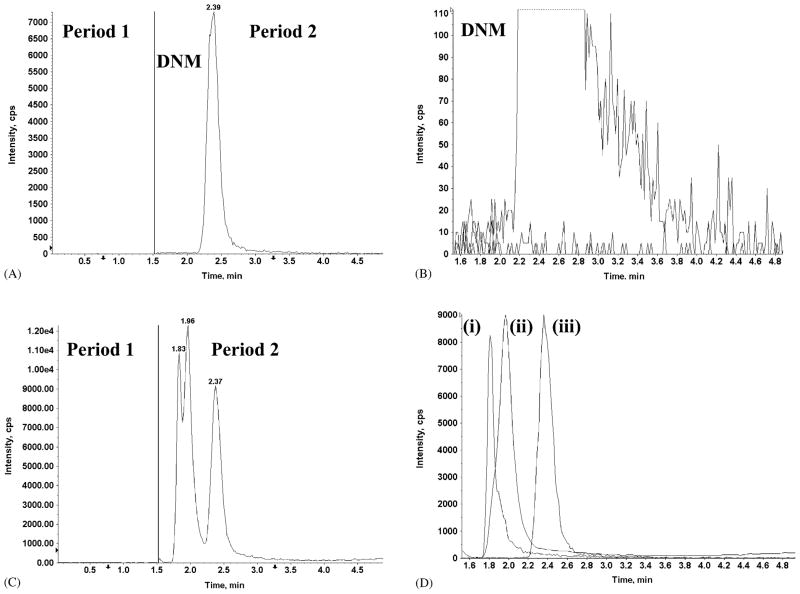
Fig. 4.
(Panels A and C) The total ion chromatogram (TIC) and (Panels B and D) product ion chromatogram (XIC) for individual ion-pairs observed in MRM mode. (Panel A) The internal standard DNM was spiked into blank plasma. In the first period (0–1.5 min), the ISV was set to 0 and no signal was detected. The ISV was restored in the second period (1.5–5.0 min) and a single peak was observed; (Panel B) MRM mode of period 2 (Panel A) identified the single peak as DNM. Low (<100 cps) background and the absence of interfering peaks was also observed; (Panel C) TIC of DXR, DXR-ol, and DNM spiked into blank plasma. Three peaks were observed in the second period; (Panel D) MRM mode of period 2 (Panel C) identified the peaks as (i) DXR-ol (1.83 min), (ii) DXR (1.96 min), and (iii) DNM (2.37 min).

