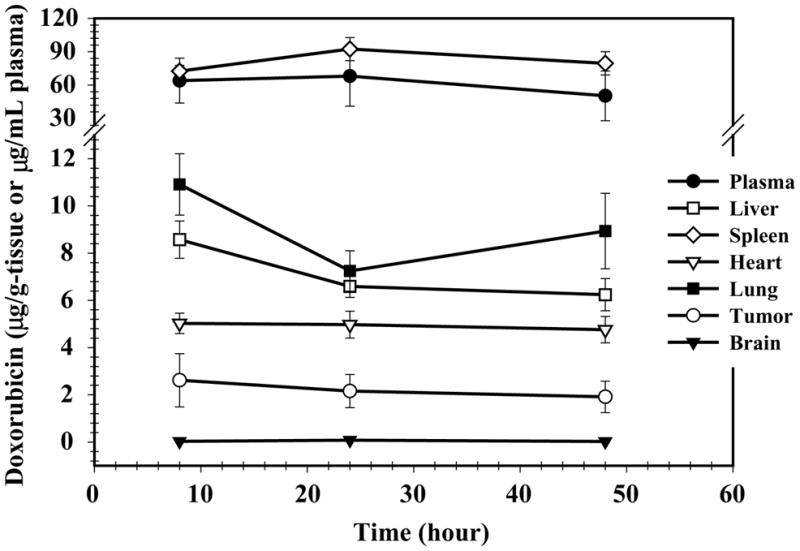
Fig. 5.

Plasma and tissue concentrations of DXR in rats treated intravenously with 5.67 mg/kg SSL–DXR by tail vein injection. Animals were sacrificed at 8, 24, and 48 h after drug administration and their tissues harvested and analyzed by LC–MS/MS. The symbols represent the mean concentration (n = 4 animals) of DXR in plasma (●), brain tumor (○), brain (▾), liver (□), spleen (⋄), heart (▽), and lung (▪) and the error bars represent the standard error of the mean.
