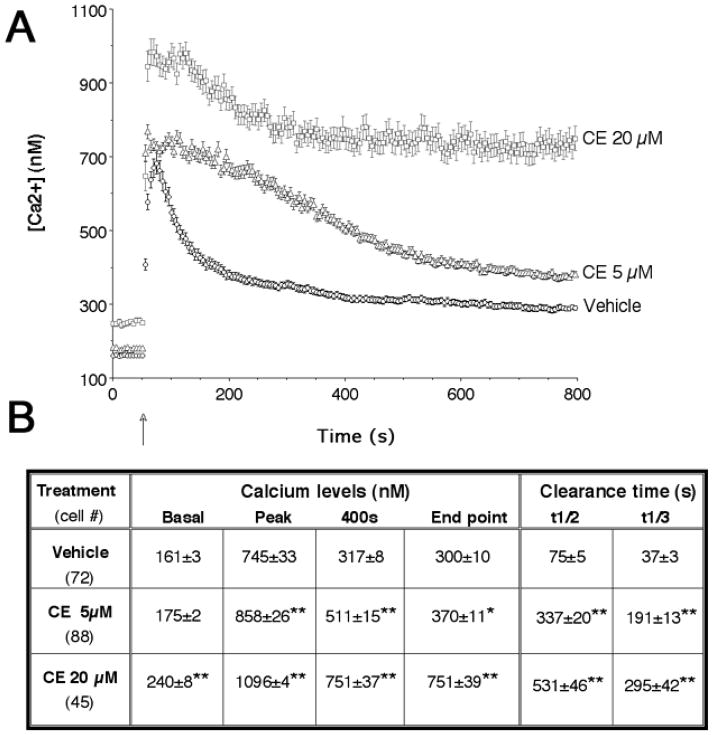
Figure 3. Effect of CE on basal and depolarization-evoked [Ca2+]i levels in spinal cord neuronal cultures.
A) [Ca2+]i changes in cells loaded with Fura-2. High K+ buffer was added at t = 46–49 s (arrow). Preincubation with CE for 1 h increased resting [Ca2+]i and prolonged the recovery from depolarization-evoked Ca2+ transients. The amplitudes of depolarization-induced [Ca2+]i peaks were also greatly increased by CE treatment. Values are presented as means ± SEM. B) Table summarizing calcium levels and clearance rates before KCl (basal), at KCl-induced peak, at 400 s (350 s after KCL addition) and at end point (t=800 s) in the experiments (A). t1/2 and t1/3 are half and one-third the time required to clear calcium transients, respectively. ANOVA for calcium levels: dose effect, F(2,202) = 93.3, P < 0.0001; time effect, F(3,606) = 897, P < 0.0001; dose X time interaction, F(6,606) = 26.4, P < 0.0001; post hoc analysis: *P < 0.05; **P < 0.01 CE vs. vehicle. ANOVA for t1/3: F(2,204) = 41.4, P < 0.0001; post hoc analysis: **P < 0.01 CE vs. vehicle. ANOVA for t1/2: F(2,204) = 85.0, P < 0.0001; post hoc analysis: **P < 0.01 CE vs. vehicle.

