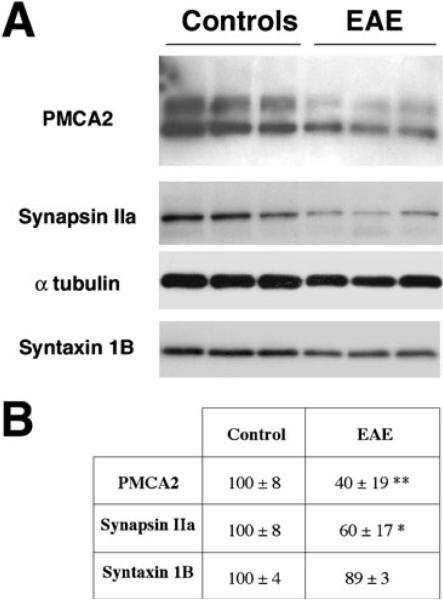
Fig. 6.
Immunoblot analysis of PMCA2, synapsin IIa, syntaxin 1B protein levels in the lumbar spinal cord of control and EAE (day 24 PI) C57Bl/6 mice. (A) Representative western blot. Protein obtained from the lumbar spinal cord of each individual mouse was loaded on separate lanes. Two major bands for PMCA2 (between 130 kDa and 145 kDa), a 78-kDa band for synapsin IIa and a 35 kDa band for syntaxin 1B are vizualized in accordance with the expected size of these proteins. The PMCA2 bands correspond to PMCA2 splice isoforms (Stauffer et al., 1993) and to different degree of oxidation of PMCA2 obtained in Tris-Gly gels (A. Nicot & S. Elkabes, unpublished observations). α-tubulin (50 kDa) was used as an internal control. The experiment was performed twice and yielded similar results. (B) Relative PMCA2, synapsin IIa and syntaxin 1B levels in the lumbar spinal cord of controls and EAE (clinical score 3, day 24 PI) C57B/6 mice assessed by western blot analysis. The results are expressed as percentage of control and represent mean ± SEM (n = 4) after normalization to α-tubulin. **P < 0.01, *P < 0.05, compared with control.

