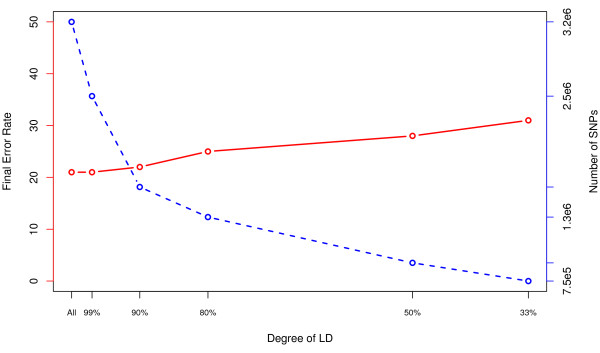
Figure 6.
Error Rate Across LD Prunes. In the red line we see the OOB error rate across the different LD prunes. There is little information lost going from the full data to pruning at 99% and even 90%. Thereafter there is more loss of information. The blue line shows the number of SNPs that were in each RF analysis.

