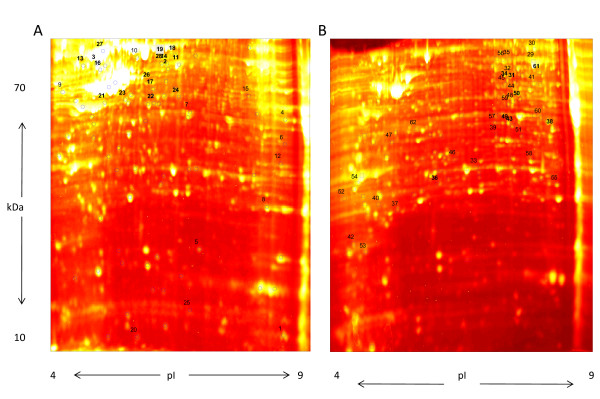
Figure 1.
Two-dimensional proteomic profile of breast cancer cell line A) BT474, B) SKBR3. The first dimension represents a section of the gel spanning pH 4-9. The second dimension is a 12% PAGE spanning molecular weights 10-70 kDa. Gels were stained with SYPRO Ruby and imaged on a Typhoon 9400 scanner. The circles and squares in panel A and B, respectively, identify picked spots. Identified proteins are labeled with ID numbers, shown in Additional File 2, Table S1.

