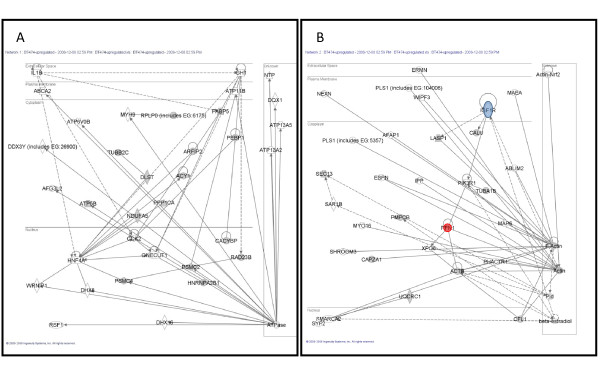
Figure 4.
Differentially expressed proteins for BT474 cell line were analyzed using a manually curated structured network tool (Ingenuity Pathway Analysis). A) Network ID 1 (p-value < 10-37) with function associated with cancer, B) Network ID 2 (p-value < 10-22) with function associated with cell morphology. White nodes are proteins identified by IPA, grey nodes are proteins identified by IPA and 2-DE, blue node is identified by IPA and validated by immunoblotting, and red node is identified by IPA and 2-DE, and confirmed by immunoblotting.

