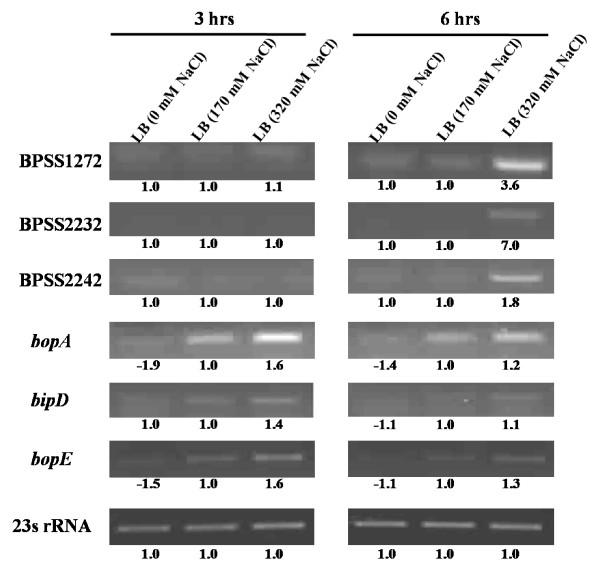
Figure 2.
Confirmation of microarray data by semiquantitative RT-PCR. Each row represents an individual B. pseudomallei gene, and columns represent transcript levels in different media. The numbers below each gel image indicate the fold change of individual band intensities between a particular condition compared to standard LB medium containing 170 mM NaCl. 23 S rRNA expression is also shown (bottom row). The level of this control RNA was unchanged under the conditions examined. No products were amplified in the absence of reverse transcriptase, indicating that RNA samples were free of DNA.

