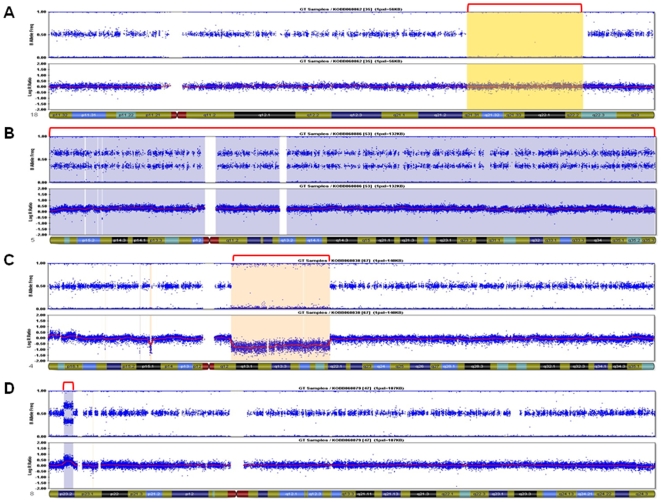
Figure 1. Visualization of identified loss of heterozygosity and large-scale copy number variation (>1 mb).
A. Plot of B allele frequency and log R ratio on chromosome 18 in sample KOBB060862. Each panel includes plot of B allele frequency (upper) and log R ratio (lower). The plot of B allele frequency shows genotype for AA, AB and BB, and the plot of log R ratio indicates signal intensity for each marker which shows copy number changes. The red line in the plot shows mean of log R ratio over 1 mb sliding window. A region representing copy-neutral loss of heterozygosity (LOH) appears in the plot of log R ratio (yellow colored box). B. Visualization of duplication on entire chromosome 5 in sample KOBB060886. The plot of B allele frequency shows four lines including top and bottom lines. In addition, the signal intensities of markers are increased in all position. C. Visualization of duplication on chromosome 8 in sample KOBB060879. The Plot of B allele frequency and log R ratio on chr8: 3674807–5938053 (size: 2.3 mb) indicates where occurred a duplication variation. D. Visualization of deletion on chromosome 4 in sample KOBB060838. The region (chr4:57782628–88983457) shows LOH and decreasing of intensity (bisque colored box).

