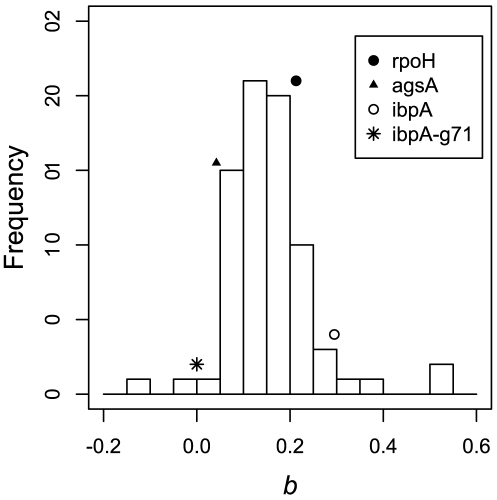
Figure 4. The distribution of MLE estimates of  of the 76 genes that differed significantly from zero in E. coli.
rpoH, ibpA and agsA genes show an increase in openness with temperature with  values 0.213, 0.295 and 0.042, respectively. However, none of these values are significantly higher than the mean of the distribution (Wilcox test,
  , respectively). In addition, when the base G71 is removed from ibpA sequence, the MLE estimate of
  reduces to 0.

