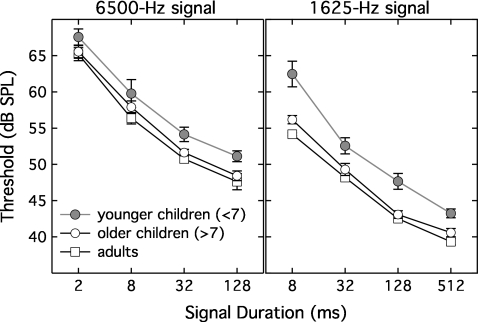
Figure 1.
Mean thresholds (dB SPL) measured at different durations, plotted separately for adults and children, as indicated in the legend. Error bars show ± one standard error. The filled circles show data of younger children, open circles show data for older children, and the open squares the data of adults. The left panel shows results at 6500 Hz, and the right panel shows results at 1625 Hz.

