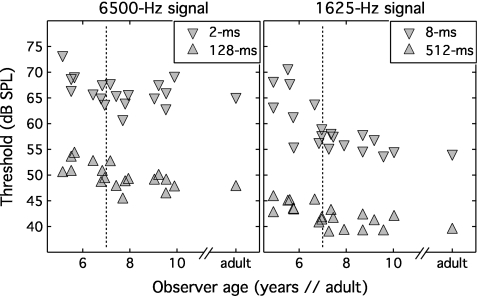
Figure 2.
Individual child thresholds in select conditions are plotted as a function of listener age, along with the associated mean adult threshold. Results for the 6500-Hz signal frequency are shown in the left panel, and those for the 1625-Hz signal are show in the right panel. As indicated in the legend associated with each panel, down-pointing triangles show thresholds for the shortest signal duration, and up-pointing triangles show those for the longest signal duration.

