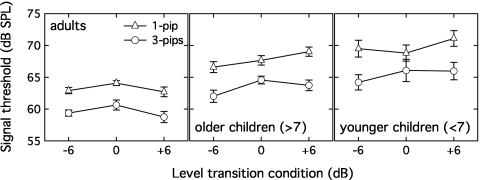
Figure 4.
Mean thresholds (dB SPL) measured for three level transition conditions, plotted separately for the two signal conditions (one pip and three pips). Error bars show ± one standard error of the mean. Circles show thresholds for three pips and triangles show thresholds for one-pip conditions. The left panel shows the results of the adults, the middle panel shows results of the children older than 7 years, and the right panel shows the results of the children younger than 7 years.

