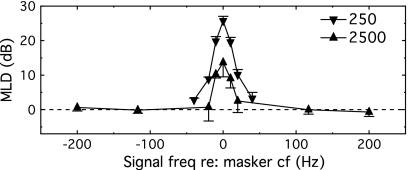
Figure 2.
Mean values of MLD are plotted as a function of signal frequency relative to the masker center frequency. Symbols indicate the masker cf: 250-Hz values are plotted with down-pointing triangles and 2500-Hz values with up-pointing triangles. Error bars indicate 1 standard error of the mean across values for individual observers (n=5). The dashed horizontal line indicates no benefit in the NoSπ as compared to NoSo condition.

