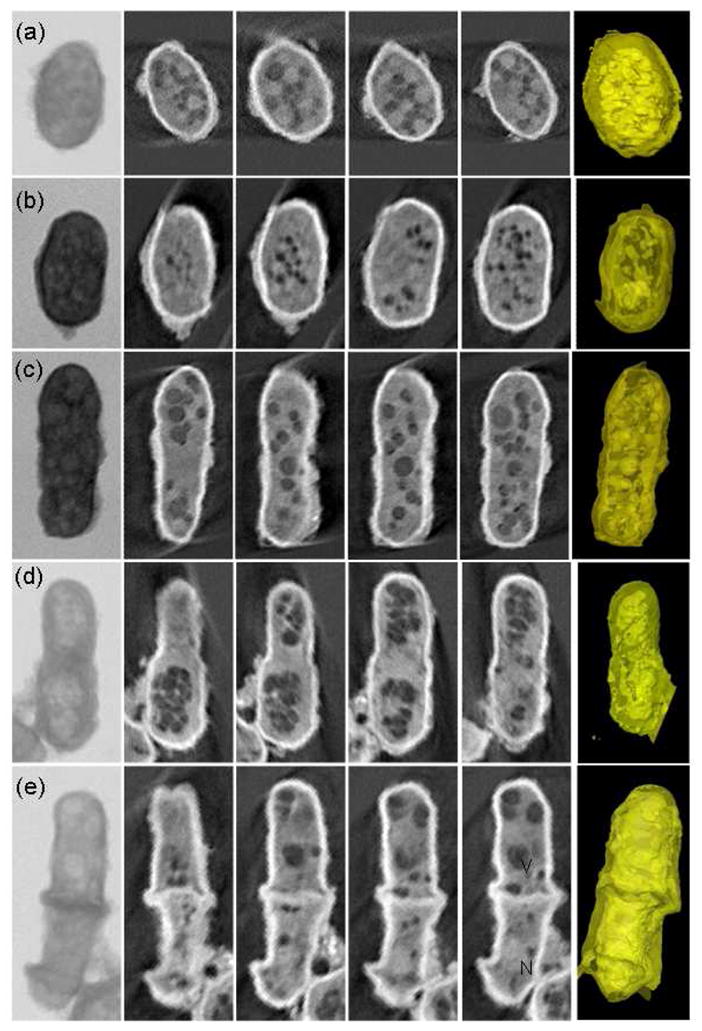
Fig. 2.

Absorption contrast tomographic results of five single cells with diameter of 2.5–3.5 μm progressed through different stages of the cell cycle. The first column is the projection x-ray image of each yeast cell. The 2nd to 5h columns are reconstructed slices through the corresponding reconstruction data showing different regions of the cells. Each slice is about 30nm thick. The 6th column contains the 3D renderings of the cells.
