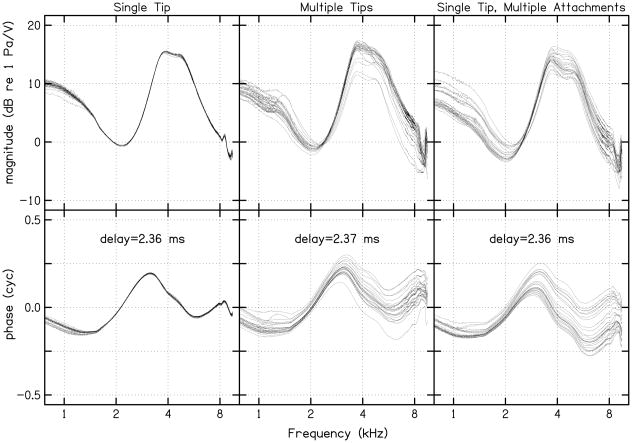
FIGURE 2.
Twenty-five calculations of source pressure from the same calibration cavities used in Fig. 1. The delay values in the bottom panels represent the time difference between stimulus generation and response recordings by the soundcard. The values plotted in the bottom row demonstrate the phase values after the number of cycles occurring within the time delay were subtracted out. The 25 cavity calibrations at body temperature, although not shown, exhibited the same pattern.

