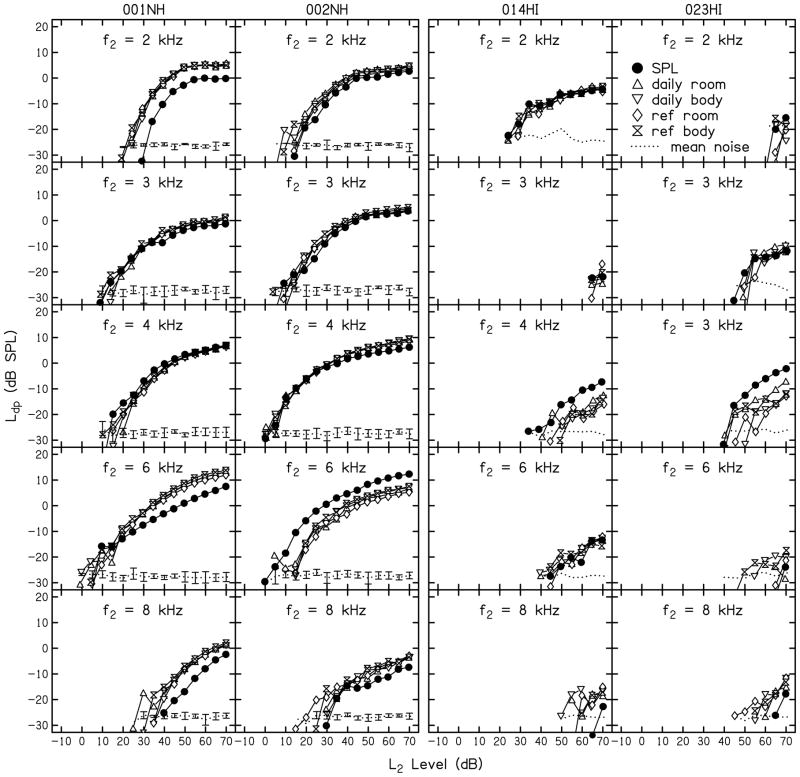
FIGURE 3.
DPOAE I/O functions from two normal-hearing and two hearing-impaired subjects are shown in separate columns. Each row provides data for a different f2 frequency. The parameter within each panel is calibration method (SPL, ref room, ref body, daily room, daily body). The mean noise level (dotted lines) represents the average noise levels for all five calibration conditions. Error bars represent the standard deviations calculated from the noise level observed among the five calibration methods. Standard deviations around the mean noise levels are not provided in the panels depicting data from hearing-impaired subjects for the reasons described in the text.

