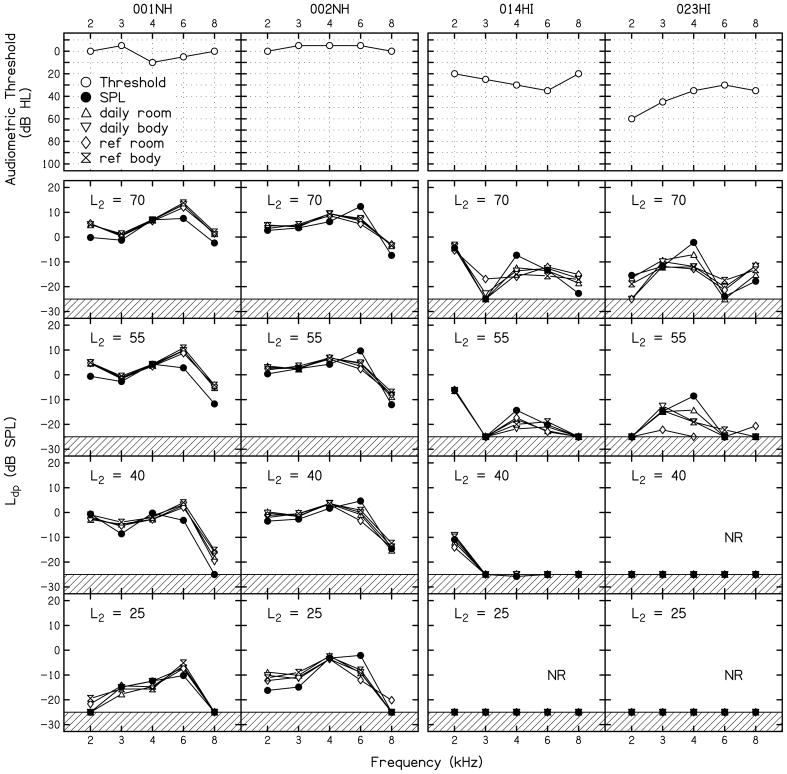
FIGURE 4.
Audiograms (top row) followed by DPgrams at four L2 levels for the same subjects whose DPOAE I/O functions were shown in Fig. 3. The data obtained from all five calibration conditions are represented within each panel. The hashed lines at the bottom of each panel represent a conservative estimate of the level at which system distortion might be observed, as described in the text. .

