
Figure 2. Flow cytometry profile of the expanded T cell progeny ± IL-7.
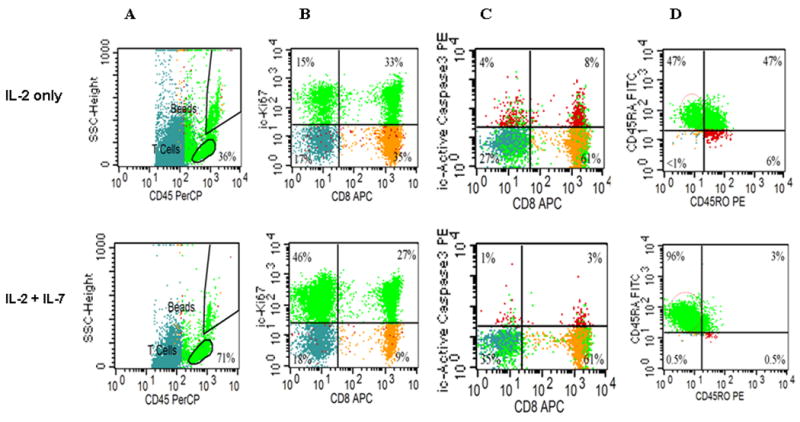
Surface and intracellular (ic) FACS characterization was performed as shown previously (10, 18, 19). The relative size of T cell subsets in each quadrant is expressed as the percentage of total viable T cells, see Table I for p values. (A) CD45-PERCP/SSC defines an unambiguous region of viable cells. All other CD45 dim cells (recently apoptotic) stain also dim for CD3, data not shown. (B) icKI-67 staining (upper quads) identifies more proliferating T cells when expanded with IL-7 than without. (C) When expanded without IL-7 more T cells undergo apoptosis and stain with ic ActiveCasp-3+ even though gated from the viable region of Fig2A. (D) More T cells display the phenotype of ‘naïve/CD45RA+/RO- T cells when expanded with IL-7. Representative of ten experiments.