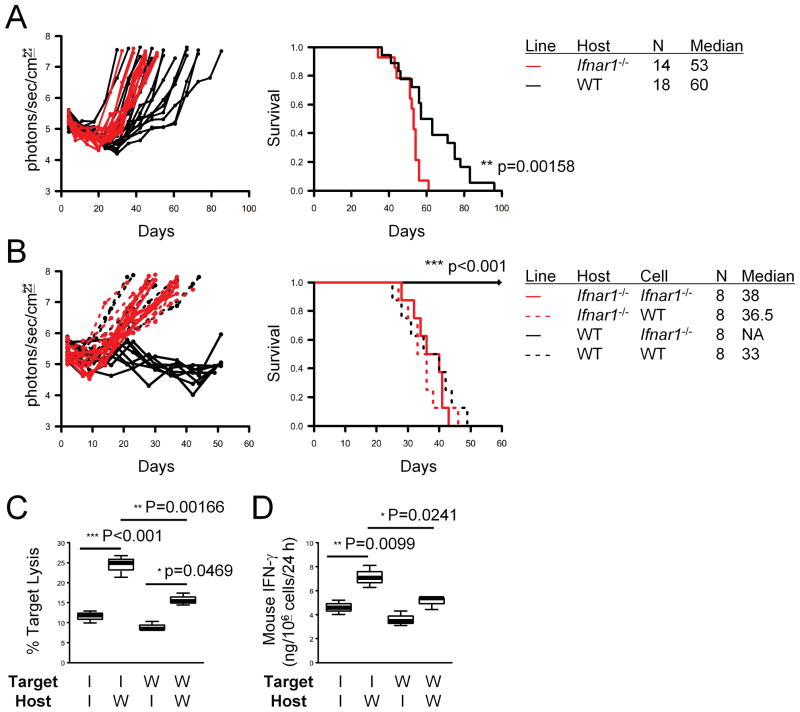
Figure 1. Ifnar1−/− mice exhibit accelerated tumor growth and death following SB-based induction of gliomas.
(A) CNS gliomas were induced in C57BL/6-background Ifnar1−/− (red lines) or WT (black lines) neonatal mice by intraventricular transfection of the following plasmids: pT2/C-Luc//PGK-SB1.a3 (0.2 μg), pT/CAG-NRas (0.4 μg), and pT/shp53 (0.4 μg). Tumor growth (left) and symptom-free survival (right) were monitored. P-values are based on log-rank test. (B) Glioma cells derived from Ifnar1−/− (solid lines) or WT (dashed lines) mice were injected into the basal ganglia of Ifnar1−/− (red lines) or WT (black lines) host mice (1 × 10⁵/mouse). Tumor growth (left) and symptom-free survival (right) were monitored. (C) 51Cr release assay was performed to evaluate cytolytic ability of cervical LN cells obtained from the mice bearing Ifnar1−/− cells (solid lines in B) against the Ifnar1−/− and WT cell lines. (D) ELISA was performed to evaluate the amount of mIFN-γ secretion by the CTLs used in (C) per the last 24 hrs. (C and D) I: Ifnar1−/−; W: WT. Lines within boxes denote means; box upper and lower bounds indicate SD; whiskers indicate minimum and maximum values. P-values are based on Holm’s post hoc test.

