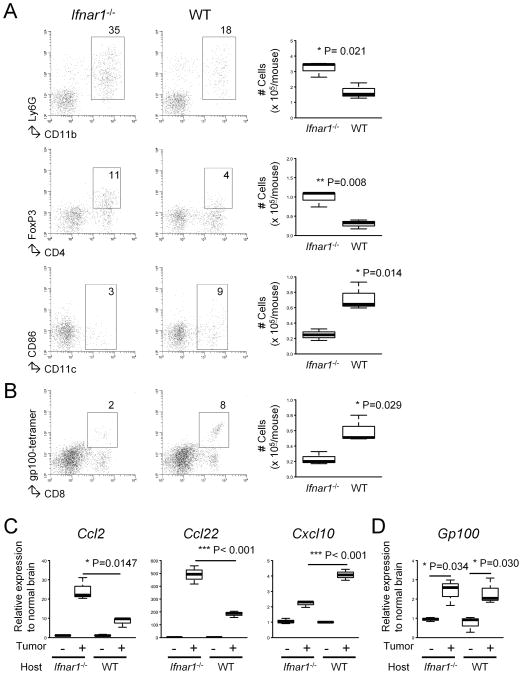
Figure 2. Ifnar1−/− mice demonstrate increased tumor-infiltration of CD11b+Ly6G+ and CD4+FoxP3+ cells but decreased Tc1 effector cells and CD11c+ DCs.
(A and B) The mice bearing SB-induced tumors were sacrificed at around days 50–60, and BILs were isolated based on similar tumor size observed by BLI. BILs obtained from 3 mice in a given group were pooled and then evaluated by flow cytometry for the following subpopulations: CD11b+Ly6G+, CD4+FoxP3+, CD11c+CD86+ (A) and CD8+gp100 tetramer+ (B). Numbers in dot plots indicate percentage of gated subpopulations in leukocyte-gated BILs. Absolute numbers are depicted in the rightmost panels. P-values are based on Student’s t-test. (C and D) Total RNA was extracted from each mouse brain (3 mice/group). Quantitative RT-PCR was performed to evaluate the mRNA expression levels of the following molecules: Ccl2, Ccl22, Cxcl10 (C) and Gp100 (D).

