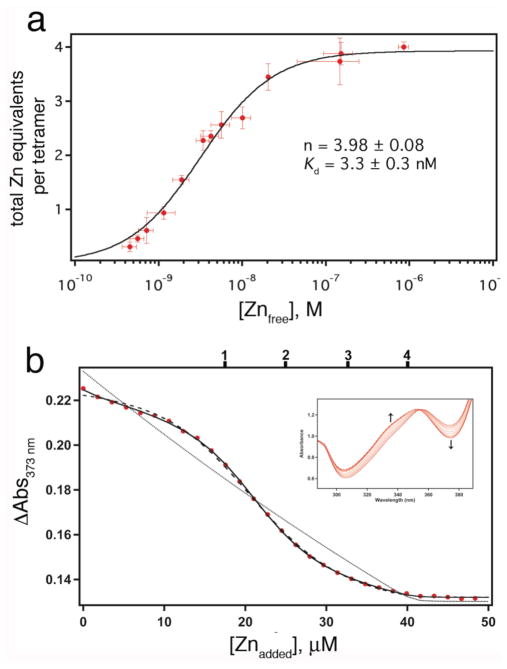
Figure 4.
(a) Zn-binding isotherm of C96RIDC-14 determined using NTA as a competing ligand. (b) Zn-binding isotherm for Fura-2–C96RIDC-14 competition experiments; corresponding changes in the Fura-2 absorbance spectrum are shown in the inset. The data are corrected for dilution and background absorbance by the protein. The sample contained 7.5 μM C96RIDC-14 and 11 μM Fura-2. The tick marks shown on the top x-axis correspond to theoretical endpoints for titration if C96RIDC-14 bound to one, two, three or four equivalents of Zn. The fits obtained using DynaFit are shown for the following different models: solid line, four consecutive Zn binding equilibria (1+1+1+1); dashed line, two consecutive binding equilibria (2+2); dotted line; single binding equilibrium (4×1). Equilibrium constants obtained with these different models are listed in Table 1.

