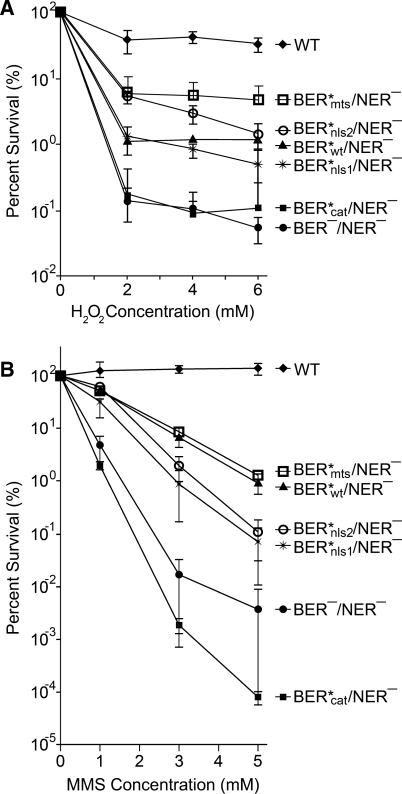
Figure 5.
Functional analysis of the dynamic localization of Ntg1. (A) The H2O2 sensitivity of wild type (WT), apn1 ntg2 ntg1 rad1 (BER−/NER−), apn1 ntg2 NTG1 rad1 (BER*wt/NER−) and apn1 ntg2 ntg1mutant rad1 (BER*mutant/NER−) cells were assessed. The percent survival was set to 100% for untreated samples and was determined for 0, 2, 4 and 6 mM H2O2 doses. (B) The MMS sensitivity of wild type (WT), (BER−/NER−), (BER*wt/NER−) and (BER*mutant/NER−) cells were assessed. The percent survival was set to 100% for untreated samples and was determined for 0, 1, 3 and 5 mM MMS doses. Error bars indicate standard deviations in data.

