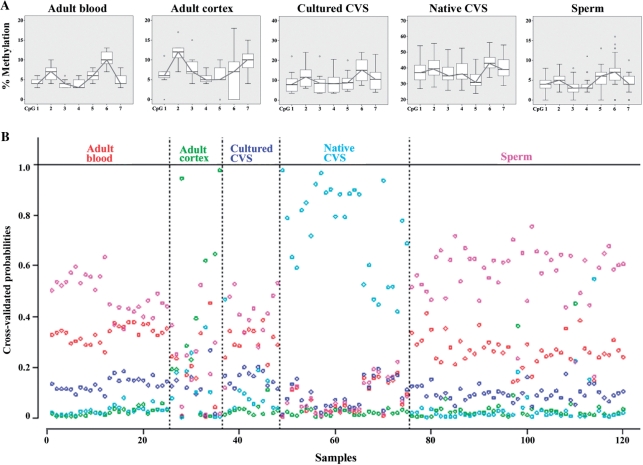
Figure 4.
(A) Methylation patterns of seven neighboring CpG sites in the APC promoter region in adult blood (n = 26), adult cortex (n = 12), cultured (n = 12) and native (n = 29) CVS from first trimester abortions, and sperm (n = 45) samples. The box plots display the distribution of methylation values at each CpG site. Please note the different graduations of scale on the y-axis. (B) PAM analysis of methylation patterns across the seven CpGs. Each sample is represented by one column. PAM uses cross-validation to calculate posterior class probabilities for each sample. A classifier which is based upon this would vote for the class with the highest posterior in a given sample. Native CVS and sperm samples would be classified correctly to a large extent, whereas almost all other samples would be misclassified as sperm.

