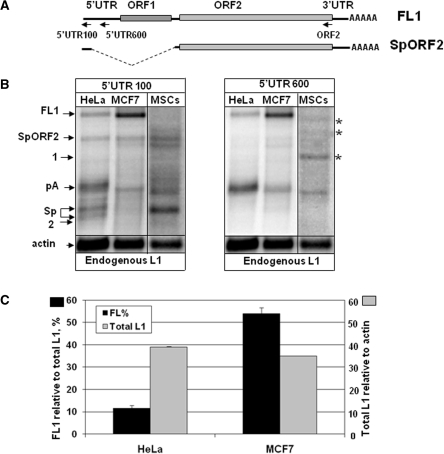
Figure 2.
Endogenous L1 expression in human adult stem cells and cancer cell lines. (A) Schematic of the full-length L1 element (FL1) and the ORF2 splice product (SpORF2). Arrows indicate the positions of the RNA strand-specific probes. (B) The left panel represents northern blot analysis of the RNA profiles of endogenously expressed L1 elements in human cervical (HeLa) and breast (MCF7) cell lines and human mesenchymal stem cells (MSCs) using the 5′-UTR 100 bp RNA strand-specific probe. The right panel is the same northern blots probed with the 5′-UTR 600 bp strand-specific RNA probe that detects polyadenylated, but not spliced, L1 mRNA. See Supplementary Figure S1B for the northern blot with the ORF2 probe. FL1, pA, Sp, SpORF2 and actin are marked as described in Figure 1. Asterisks mark bands specific to human MSCs. (C) Relative L1 expression and processing in MCF7 and HeLa cells. Black bars indicate the amount of the full-length L1 mRNA as a percentage of the total L1-related products detected in each cell line with the 5′-UTR 100 bp probe (scale shown at the left y-axis). Gray bars represent expression of all L1-related transcripts detected in each cell type relative to actin mRNA expression (scale shown at the right y-axis). Note that even though both cell lines express similar steady-state levels of the total L1 mRNAs, the full-length L1 mRNA composes only 10% of the total L1 products in HeLa cells compared to over 50% in MCF7 cells.

