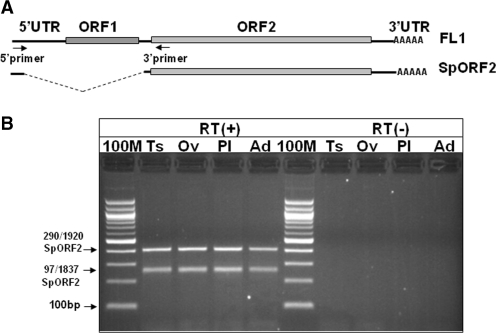
Figure 3.
Various adult human tissues support production of the spliced L1 transcript that has a potential to produce ORF2 protein. (A) Schematic of the full-length L1 element (FL1) and the spliced ORF2 transcript (SpORF2). Arrows indicate the positions of the RT–PCR primers. (B) RT–PCR analysis of the L1 splice products in human Ts, testis; Ov, ovary; Pl, placenta; Ad, adrenal gland. RT(+) and RT(−) panels indicate reactions with and without RT, respectively. 100 M, 100 bp marker. The two differentially migrating bands represent L1 splice products utilizing various L1 splice donor and acceptor sites (indicated on the left).

