
Figure 4.

(A) Neighborhood conservation function of the form 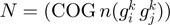 where
where  is an orthologous group pair from COG database and
  is its neighborhood conservation score in our set of 300 non-redundant genomes. (B) STRING
  function of the form
 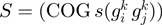 where
where  is an orthologous group pair and
  is its STRING functional association score. (C)
  function intervals that will be approximated to
  function intervals (blue with blue interval and red with red one) using a lineal piecewise continuous approximation. (D)
  function resulted by matching
  to
to  functions.
  represents our STRING-like score.