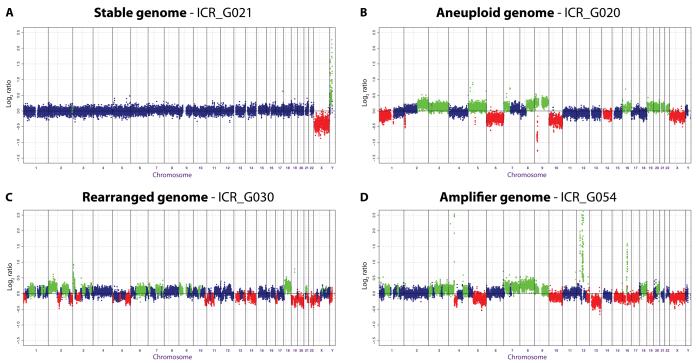
Figure 1. Paediatric high grade gliomas are comprised of different subtypes of copy number profiles.
Sample genome plots are given for (A) “Stable” (B) “Aneuploid” (C) “Rearranged” and (D) “Amplifier” genomes within our sample cohort. Log2 ratios for each clone (y axis) are plotted according to chromosomal location (x axis). The centromeres are represented by vertical lines. Points are coloured green and red to represent gains and losses, respectively.

