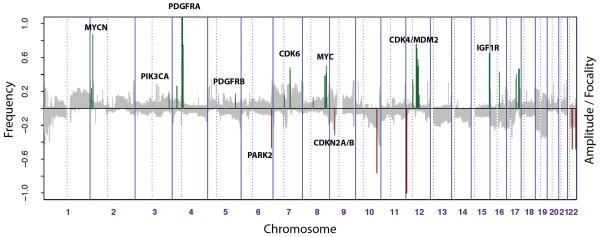
Figure 3. Summary and significance of genomic aberrations in paediatric high grade glioma.
The proportion of tumours in which each clone is gained or lost is plotted in grey (y axis) for each BAC clone according to genomic location (x axis). A measure of the frequency, amplitude and focality of high level events was calculated for each affected clone and was overplotted for amplifications (green) and deletions (red), scaled to the absolute maximum for each.

