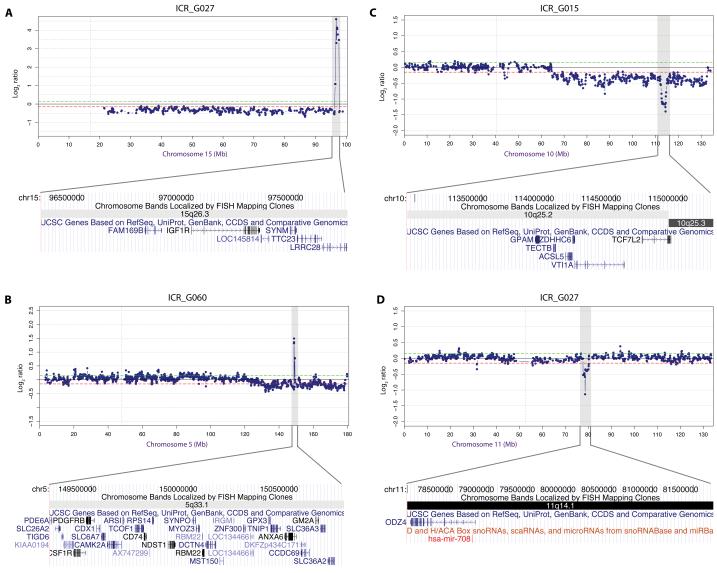
Figure 4. Novel low-frequency amplifications and fine-mapping focal deletions in paediatric high grade glioma.
Chromosome plots for (A) chromosome 15, targeting IGF1R; (B) chromosome 5, targeting PDGFRB/CSF1R; (C) chromosome 10, mapping a deletion at 10q25.2-q25.3; and (D) chromosome 11, resolving a deletion at 11q14 to ODZ4 and hsa-mir-708. Log2 ratios for each clone are plotted (y axis) for each BAC clone according to location (x axis) along the length of the chromosome, with genes and microRNA within the minimal regions plotted underneath according to positional information from the UCSC Genome Browser (hg18).

