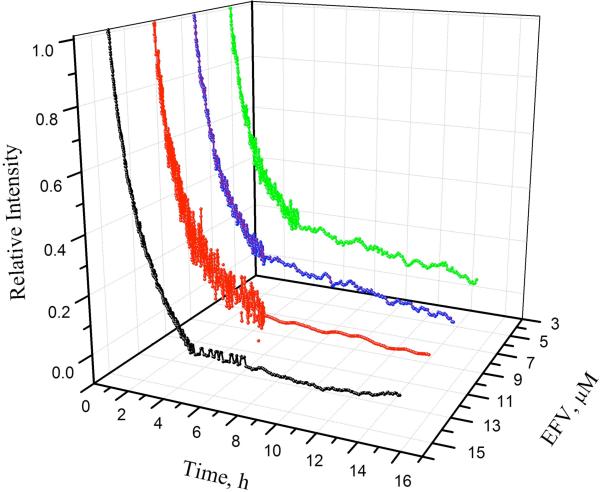
FIGURE 4.
Progress curves for p51W401A binding to efavirenz monitored by tryptophan fluorescence at 5 °C. λex = 295 nm, λem = 340 nm. 2.5 μM p51W401A; ( ) 5 μM, (
 ) 8 μM, (
 ) 11 μM, and (—) 14 μM efavirenz. Data acquired at 30 s intervals for first 4–5 h, then at 5 min intervals. Data were fit to eq 2a to obtain kobs.

