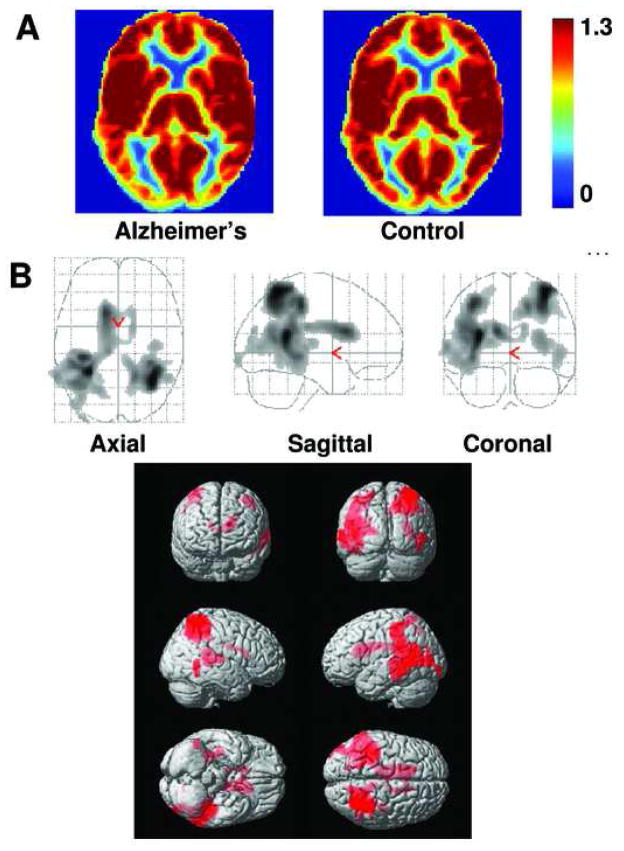
Fig. 2.
Comparison of relative CBF maps in AD and controls. (A) Averaged CBF maps in the patient (left panel, N=15) and control (right panel, N=14) groups. Warmer color indicates a higher CBF value. Color bar shows the range of 0 to 1.3 times the whole-brain CBF. (B) Voxel-based maps of age-corrected and vascular risk factor-corrected CBF differences between AD and controls. The top panel shows the glass brain overlay and the bottom panel shows the rendering on the MNI brain template. Colored voxels indicate brain regions with CBF deficits. The deficits are most pronounced in temporoparietal cortex.

