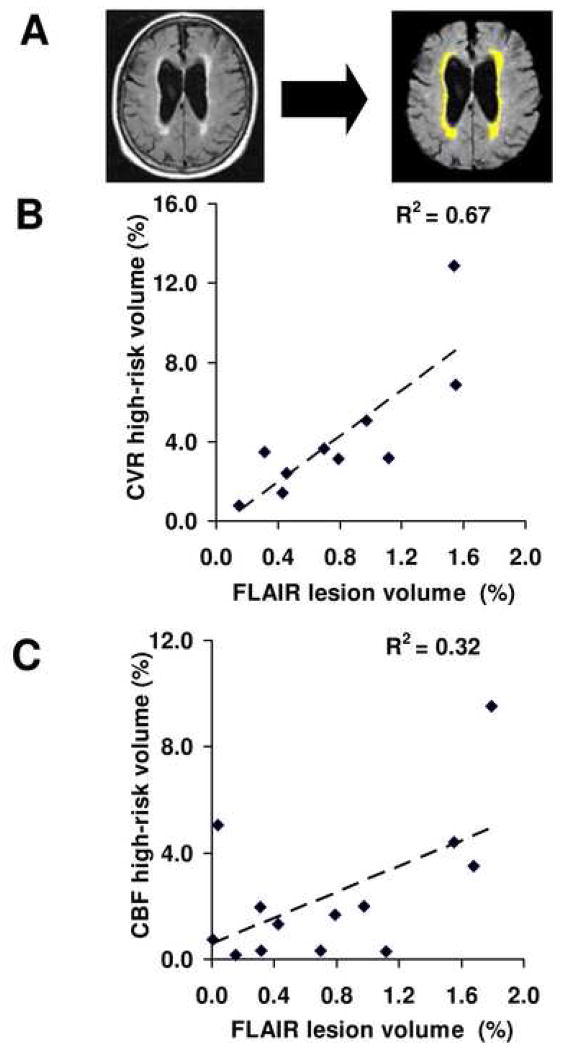
Fig. 3.
Relationship between FLAIR lesion volume and CVR/CBF deficit volumes in AD patients. (A) Tissue lesions were delineated based on the FLAIR MR images using a semi-automatic method reported previously. (B) Scatter plot between FLAIR lesion volume and CVR high-risk volume across patients. Each dot represents data from one patient. The volumes are written in term of fractions of the whole brain white matter volume. A strong positive correlation (p=0.004) is seen between these two parameters. (C) Scatter plot between FLAIR lesion volume and CBF high-risk volume across patients. A weak correlation is observed (p=0.043).

