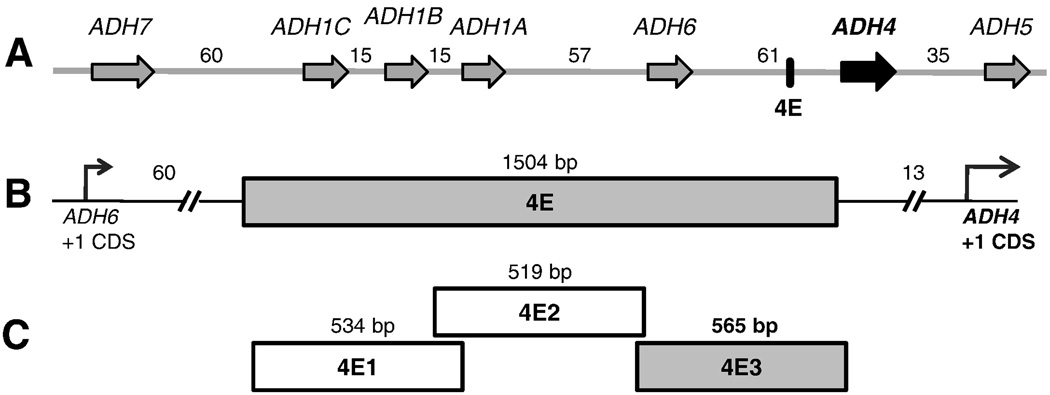
Figure 1. Diagram of the ADH cluster, highlighting the test regions.
(A) Seven alcohol dehydrogenase genes are shown in their transcriptional orientation (they are oriented on chromosome 4q in the opposite direction). Arrows mark the genes and depict the direction of transcription. The genes range in size from 14.5 kb to 23 kb; intergenic distances are in kb. (B) The conserved region (4E) is enlarged; distances are in kb from +1 CDS of ADH6 and ADH4. (C) Sub-fragments of 4E that were tested for activity; sizes in bp. Segment with enhancer activity is shaded.

