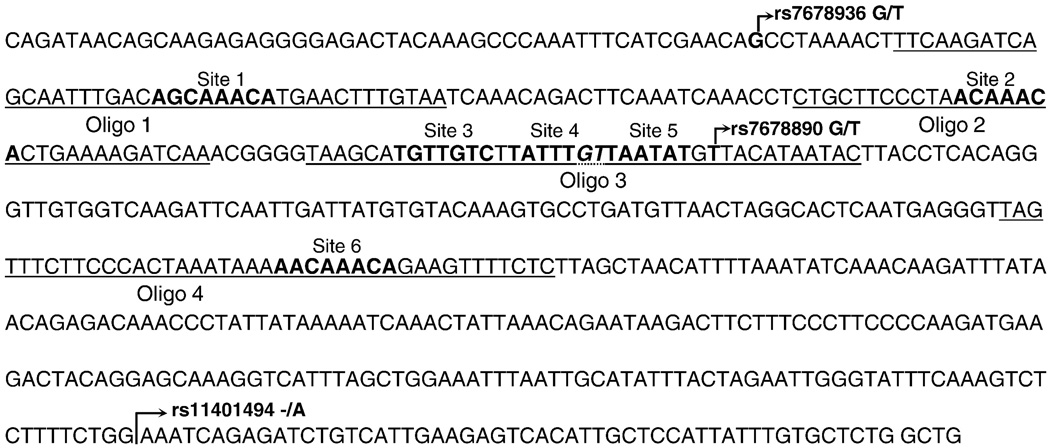
Figure 4. The genomic sequence of the 4E3 region.
Six potential transcription factor binding sites, identified using Promo (Messeguer et al., 2002), are shown in bold along with the site name above the sequence. Two nucleotides shared by sites 4 and 5 are shown in italics. Oligonucleotides used in EMSA are underlined. Known variations within the sequence are represented with an arrow.

