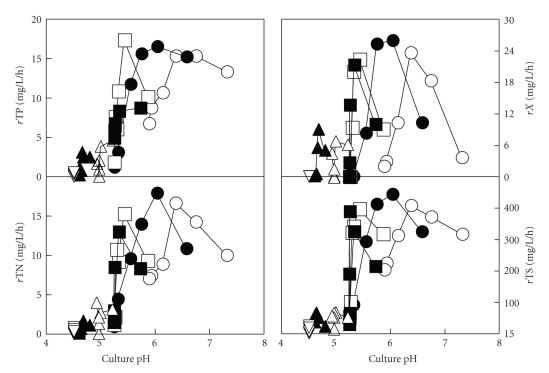
Figure 2.
Changes in the absolute mean rates of growth (rX) and nutrient consumption (total phosphorous (rTP), total nitrogen (rTN), total sugars (rTS)) with respect to the culture pH in the batch cultures of Ent. faecium CECT 410 on DW media adjusted to initial pH values of 7.5 (○), pH 7.0 (●), pH 6.5 (□), pH 6.0 (■), pH 5.5 (∆), pH 5.0 (▲), and 4.5 (∇).

