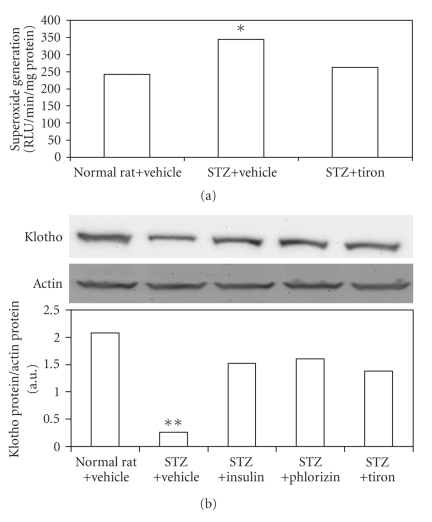
Figure 2.
Alteration of superoxide generation (ROS) in the kidneys of STZ-diabetic rats treatmented with tiron. Klotho protein in the kidneys of STZ-diabetic rats treatmented with isulin, phlorizin and tiron. (a) Lucigenin assay of the STZ-diabetic rats. Western blot analysis of (b) Klotho expression in the kidneys of STZ-diabetic rats. Upper picture shows protein levels or the corresponding β-actin levels shown as loading controls in kidneys isolated from STZ-diabetic rats. The different treatments are described in materials and methods. Quantification of protein level using Klotho/β-actin, expressed as means with SE (n = 4 per group) in each column are presented in the lower panel. *P < .05, **P < .001 compared to the value of vehicle-treated normal rats.

