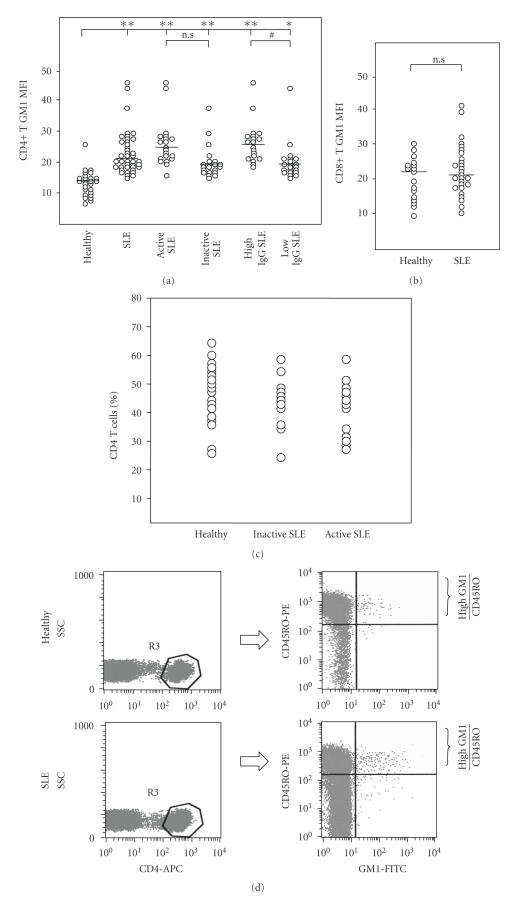
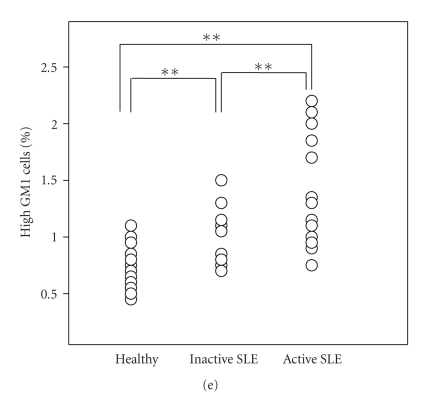
Figure 2.
Lipid raft/GM1 expression on CD4+ T cells (a) and CD8+ T cells (b). SLE patients were divided into subgroups; active SLE group (n = 21) versus inactive SLE group (n = 23) according to SLEDAI scores, and high IgG group (n = 24) versus normal IgG group (n = 20) according to serum IgG level. *Statistically significant differences compared to the healthy (*P < .05, **P < .01). #Statistically significant differences between subgroup with high IgG and normal IgG. (P < .01) (Two-tailed unpaired Student's t-test). (c) Percentage of CD4-positive T cells among healthy controls (n = 23), inactive (n = 11) and active SLE patients (n = 13) were 46.9+2.17, 42.2+3.04 and 38.8+2.64, respectively. (d) GM1 expression on CD45RO+/CD4+ memory T cells by triple staining. Cells were first gated by CD4-APC, then analyzed with PE-CD45RO antibody and FITC-GM1. Cells with more than 10 in MFI of GM1 were determined as high GM1 cells. (e) Percent of high GM1-expessing CD45RO+/CD4+ memory T cells among normal controls, inactive and active SLE patients (0.69 ± 0.03, 1.00 ± 0.07, 1.35 ± 0.12, resp.). ∗∗P < .01


