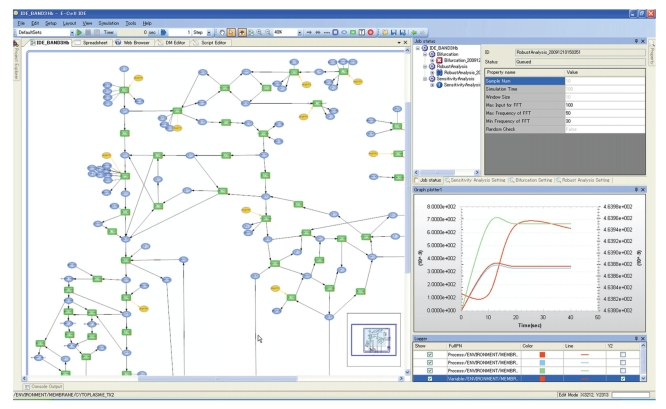
Figure 1.
View of the on-screen E-Cell GUI (E-Cell IDE). The E-Cell IDE has a user-friendly pathway editor (left) and a GUI-based mathematical analysis tool kit (right top). The simulated dynamics is visualized in the tracer of the time histories of variables/processes (bottom right), as well as in the pathway map (left).

