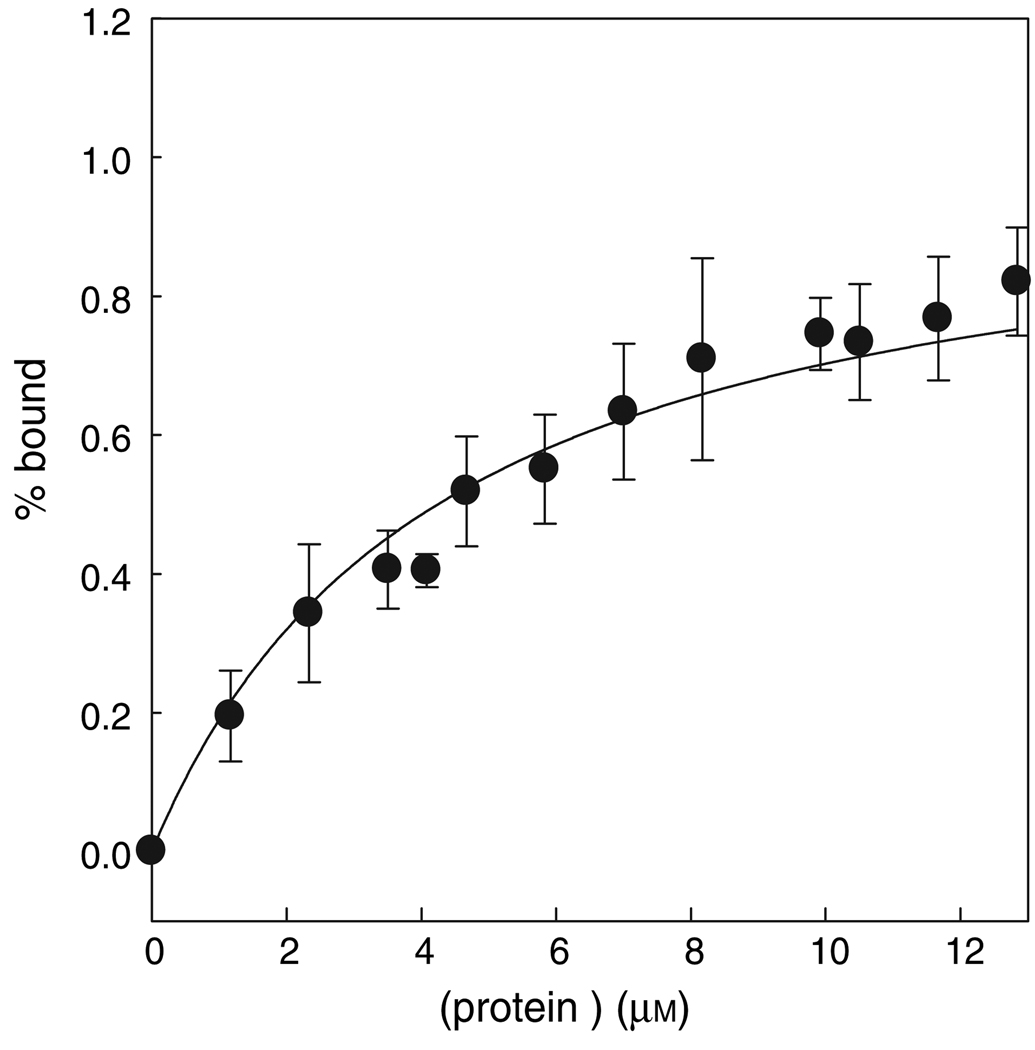
Figure 4.
Determination of the dissociation constant (Kd) using fluorescence anisotropy measurements. Affinity of the probe for a His10-tag was estimated using CRABP I wt* protein. The error bar represents the standard error between two independent measurements at each concentration of the protein. Data were fit as described in Materials and Methods section, yielding a Kd of 5.0 µm.

