
Figure 3.
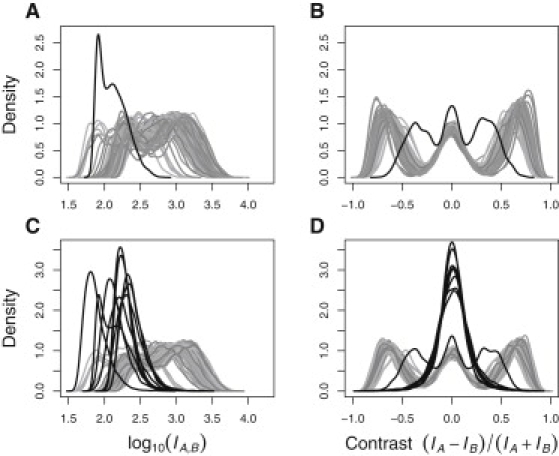
Log-Transformed Probe-Intensity and -Contrast Distributions for the Samples on Plate 4RWG569
The top row corresponds to the panel of Nsp-specific SNPs, and the bottom row corresponds to the panel of Sty-specific SNPs. Solid black curves represent the eight samples with Sty target-preparation failure. In addition to these, one more sample identified by SQC and CQC as failing on both Sty and Nsp panels appears in all four plots and is especially evident in (A) and (B).