
Figure 2.
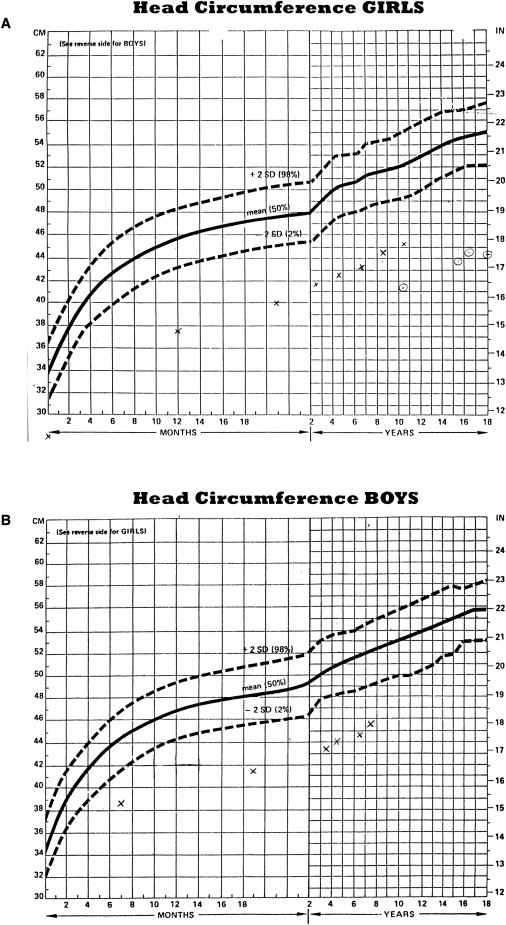
Growth Charts Tracking the Head Circumference of Our Microcephalic Patients from an Early Age Compared to Population Means for Girls and Boys
Solid lines show the mean head size at various ages. Dashed lines show the limits of two standard deviations above or below the mean size.
(A) Females: x represents patient 1669, dotted circle represents patient 1937.
(B) Males: x represents patient 1672.