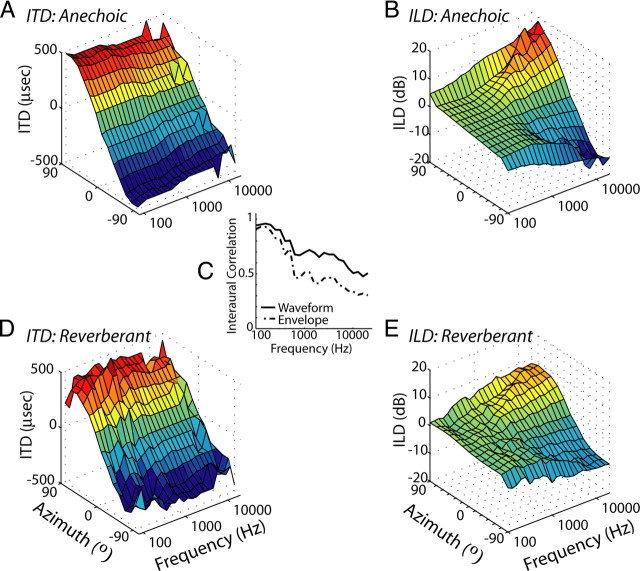
Figure 1.
Analysis of binaural cues for virtual space stimuli. A, D, Waveform ITD as a function of frequency and virtual source azimuth for anechoic (A) and reverberant (D) ITD+ILD virtual space stimuli used in the present experiments. Waveform ITD is estimated as the delay corresponding to the peak of the interaural cross-correlation function computed in ⅓-octave bands. C, Peak interaural correlation as a function of center frequency computed in ⅓-octave bands from the stimulus waveform (solid line) and its Hilbert envelope (dashed line). Graph depicts average value across all azimuths. B, E, ILD computed in ⅓-octave bands as a function of filter center frequency and virtual source azimuth for the anechoic (B) and reverberant (E) ITD+ILD virtual space stimuli.

