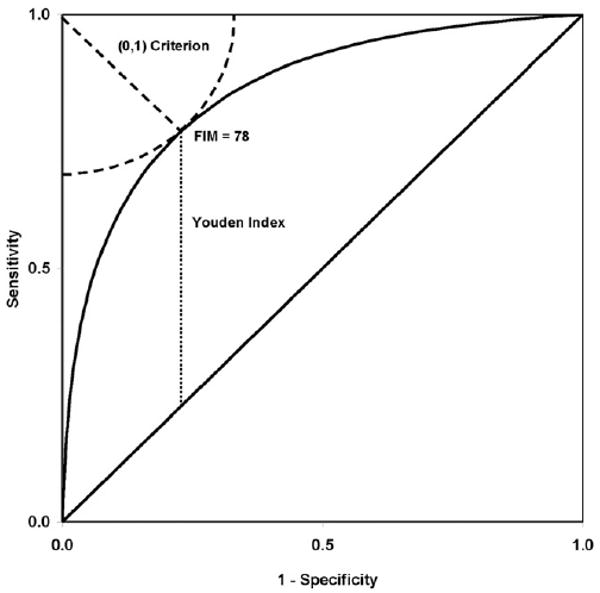
Fig 2.

ROC curve for discharge FIM total scores to differentiate between community and institutional discharges. The same cut point (FIM=78) was identified by the closest-to-(0,1) and Youden Index approaches, which locate the point on the ROC curve closest to perfect discrimination and furthest from chance discrimination, respectively.
