
Figure 15.
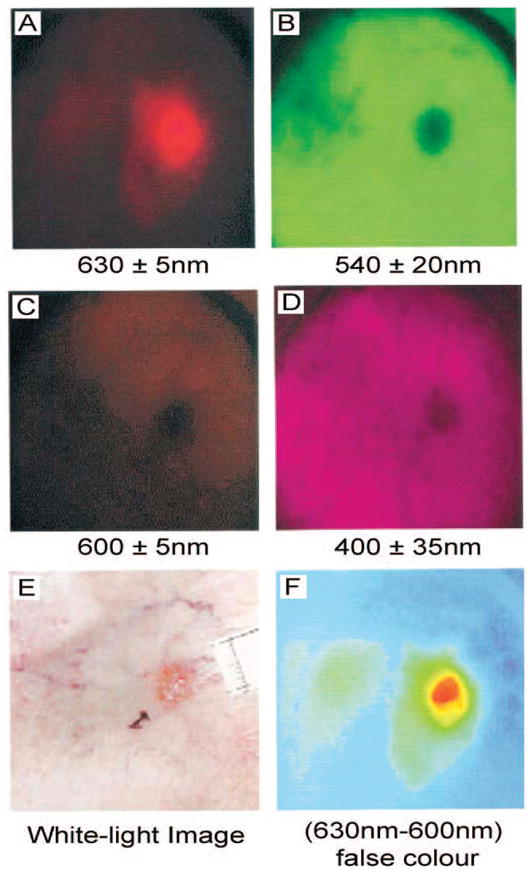
Multispectral images (A-D) taken pre-PDT of a superficial BCC on the ankle and the corresponding white-light image (E) taken before ALA application. Real-time image processing displays the difference between the 630 and 600 nm images displayed with a false color scale (F) showing clearly the extent of the lesion and the differential accumulation of PpIX in the SBCC compared with the application site and surrounding healthy tissue. Scale bars for these images were not available. (Figure reproduced with permission from ref 113. Copyright 2001 Wiley.)