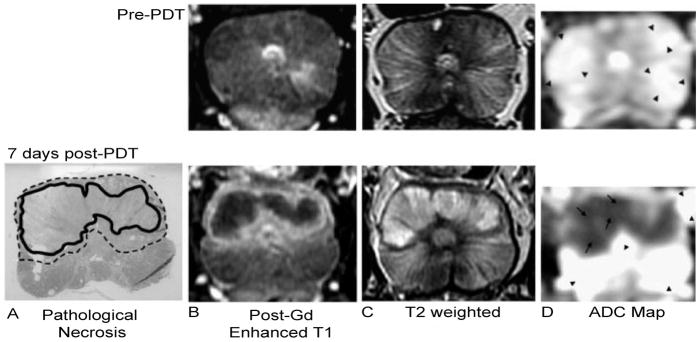
Figure 21.
An example of structural imaging for PDT outcome assessment. PDT of the prostate was monitored with MRI before (top panel) and 7 days after PDT (bottom panel). The results of Tookad-PDT in the prostate are evident. A) The pathological necrosis is circled with the bold black line, while the transition region showing signs of inflammation and edema is indicated with the dotted line. Post-gadolinium contrast-enhanced T1-weighted MRI (B) shows that the necrotic region does not enhance, while the transition region strongly enhances. The opposite is seen in the T2-weighted image (C). D) The apparent diffusion coefficient map indicates that the necrotic region (arrows) has a different diffusion rate (1000 × 10−6 mm2/s) than the remaining prostate (arrow heads, 2500 × 10−6 mm2/s). (Reproduced with permission from ref 178. Copyright 2006, Wiley.)

