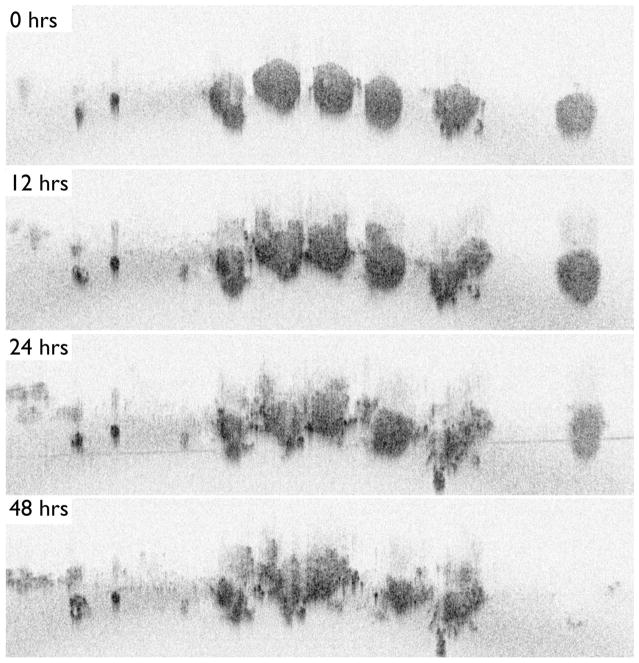
Figure 24.
An application of TLOCT for studying the basic tumor biology of PDT response, demonstrating a series of OCT cross-sectional images of ovarian cancer acini taken from a full 3D data set at time points following BPD-PDT. (A) Ovarian cancer acini appeared as small, solid and spherical structures immediately following treatment (B). Twelve hours post-PDT, signs of structural breakdown were seen (C). One day after PDT, the acini showed large-scale structural deformation with the appearance of apoptotic cell clusters at the nodules’ periphery. Few structural differences can be seen between 24 and 48 hours (D) following treatment. Reproduced with permission from ref 301. Copyright 2010, SPIE.

