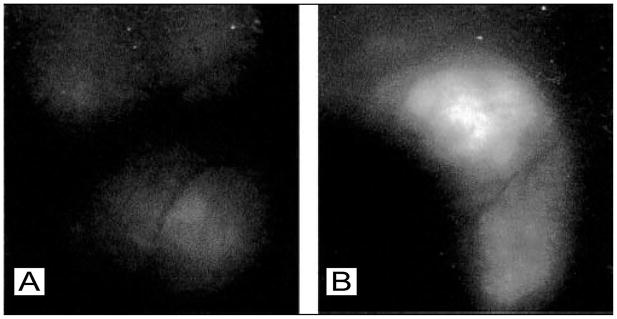
Figure 28.
In vivo molecular imaging of a cellular stress response to PDT. The figure shows images of increased heat shock protein expression in an EMT6 (mouse mammary carcinoma) tumor, a molecular response to acute cellular stress during PDT. In this experiment, GFP-transfected EMT6 cells were implanted into mice subcutaneously, where GFP expression is driven by the activation of the heat shock protein 70 (HSP70) promoter and GFP fluorescence is used to visualize the HSP70 expression level. (A) Before and (B) 6 hours after PDT. The GFP fluorescence increases substantially following PDT, indicating an up-regulation in HSP70 expression. (Reproduced with permission from ref 346. Copyright 2003 Wiley).

