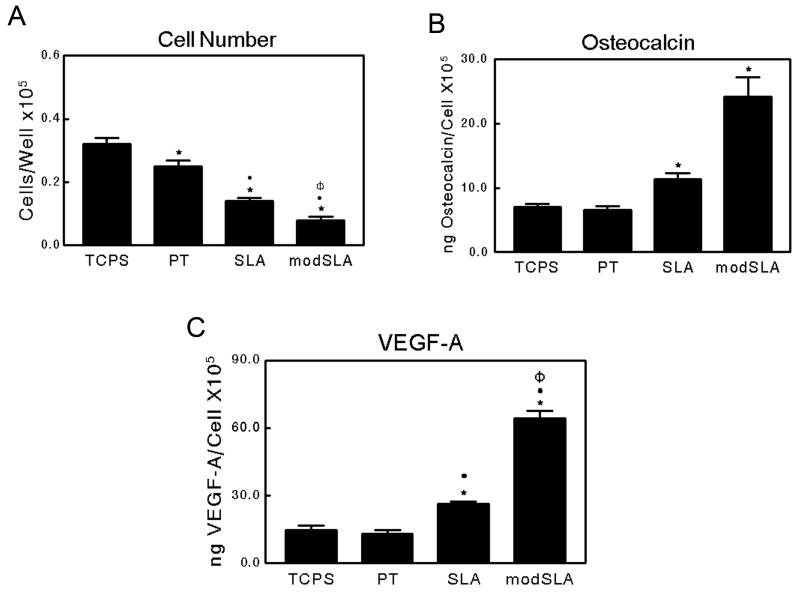
Figure 3.
Characterization of normal human osteoblasts cultured on TCPS, PT, SLA, and modSLA Ti surfaces: (A) cell number, (B) osteocalcin, and (C) VEGF-A levels in the conditioned medium. Values presented are mean ± SEM of six independent cultures. The data presented are from one of two separate experiments with comparable results. Data were analyzed using ANOVA and statistical significance between groups was determined using Bonferroni's modification of Student's t-test. *p< 0.05 vs. TCPS; ·p<0.05 vs. PT; Φp<0.05 vs. SLA.

