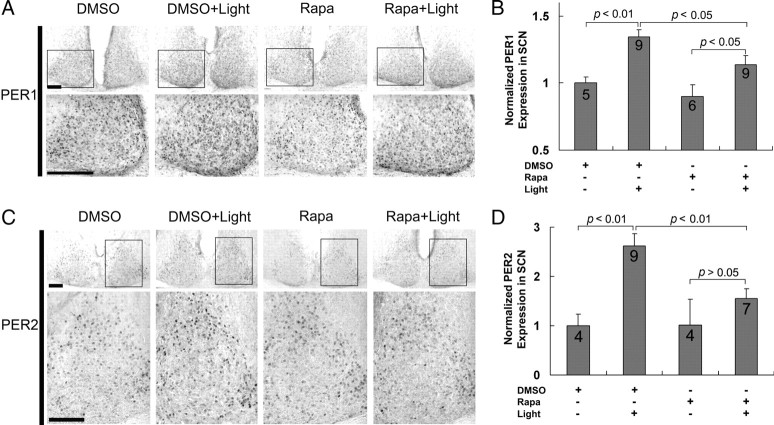
Figure 6.
mTOR facilitates early-night light-induced PER1 and PER2 expression in the SCN. A, C, Representative immunohistochemical labeling for PER1 (A) and PER2 (C) protein expression in the SCN. Cannulated mice were dark adapted for 2 d and then infused (CT14.5) with rapamycin (100 μm) or DMSO vehicle and exposed to light (400 lux, 15 min) at CT15. After light exposure, animals were returned to darkness for 4 h and then killed at CT19. In addition, two “no light” control groups were infused with DMSO or rapamycin at CT14.5 and killed at CT19. Immunolabeling revealed that light (DMSO+Light) evoked an increase in PER1 and PER2 expression relative to the control condition (DMSO). PER1 induction was mainly located in the ventral SCN (A), whereas the increase in PER2 expression was predominantly located in the lateral and dorsal regions of the SCN (C). For each representative section, the boxed area is magnified and shown below. Scale bars, 100 μm. B, D, Quantification of light-induced PER1 (B) and PER2 (D) expression in the SCN. Of note, the light-induced increase in PER1 and PER2 expression was significantly attenuated by rapamycin. Under basal conditions, rapamycin led to a modest but statistically insignificant decrease in PER1 and PER2 protein expression. Numbers in the bars denote the number of animals analyzed for each condition. PER1 and PER2 expression data were normalized to the DMSO infusion condition, which was set to a value of 1.

